

Whistling DXY

As promised in my last article, I am writing a piece on the USD and the Dollar Index, the DXY. The USD has a huge impact in all things macroeconomics and it can positively and negatively affect investment strategies from equities to bonds to precious metals and commodities. My aim is to consider the macro landscape to determine whether Q4 will be positive for risk assets in general.
The US Dollar whistles and the whole world watches waiting to react to the moves.
Introducing BUY ME A COFFEE, where you can literally buy me a coffee if you appreciate this article or a combination of my articles at the following link; https://www.buymeacoffee.com/walkinggentleman, its totally discretionary and as little as €5.00. Yep coffee is expensive these days.
What is the DXY?
The DXY (pronounced Dixie for the purposes of this article) is the USD Index against Global currencies - Euro 57.6%, Japanese Yen 13.6%, British Pound 11.9%, Canadian Dollar 9.1%, Swedish Krona 4.2% and Swiss Francs 3.6%. Given the high Euro weighting it goes without saying that the EUR/USD pairing is crucial in the DXY Index.

Charts
The Weekly DXY Chart below shows a 2023 range of consistent lower lows and lower highs. While we are experiencing a break out from a trendline we are getting to the end of the Bollinger Bands and we closed out 8th green candle in a row this week.
Typically candles start to reverse post a 9 count, using a DeMark Indicator (which sadly seems to have fallen off Trading View). We do appear to have retested the break out and we could hit the Measured Move Price Target of 107.50 but something doesn’t feel right with this inverse head and shoulders pattern. The inverted head should be lower, as in printed the lowest low, while the right inverted shoulder should be higher, it is not. This makes me think that this structure is not as bullish as it looks. Lets switch to another indicator to helps us out.

The Stochastic RSI (Stochastic Relative Strength Index) is a useful indictor to understand where we are in a buying cycle. This weekly chart highlights that we are in an over bought zone and that we could well roll off as previously done in the next handful of weeks.

Fed and ECB Policy
The Fed Funds Rate is 5.25-5.50% and US CPI printed for July at 3.2%, while the next CPI is due next week (for August) it is unlikely to spike upwards above the Fed Funds Rate and with 3 FOMC meetings left in the year, one more hike (if any) is the best that could be hoped for hawkish US Central Bankers.
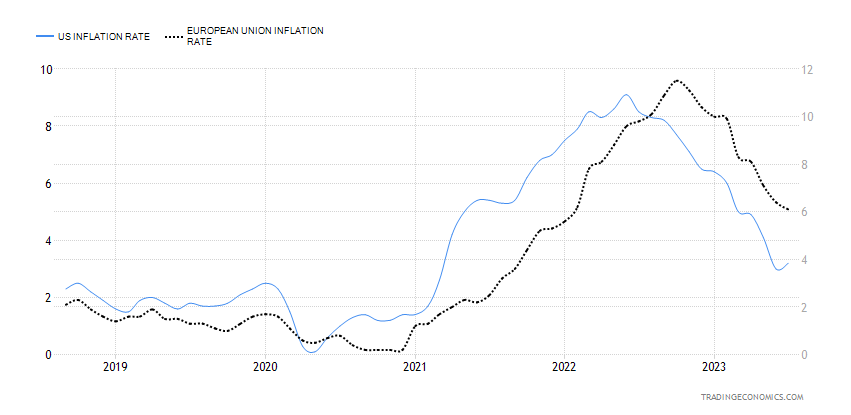
Mark this in contrast to the ECB who are still combating inflation YoY above 6.0% while the ECB Cost of Funds sits at 4.25%, it has never risen above the headline CPI rate, like in the USA.
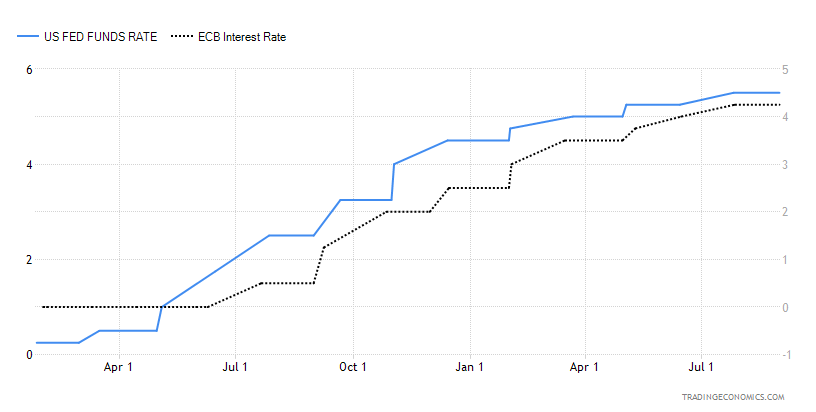
In short, the ECB has more hiking in order to tame the Euro Area Inflation Rate and while the Fed potentially pauses when it hits its terminal Fed Funds Rate, the value of the Euro will increase as its cost of capital increases. Leading to a potential strengthening of EUR/USD.
EUR/USD Currency Pairing
Given its heavy weighting as mentioned earlier, the EUR/USD chart is more or less the inverse of the DXY Chart. What emerges when you do review it and there is a more attractive and understandable chart pattern emerging, i.e. the W pattern.
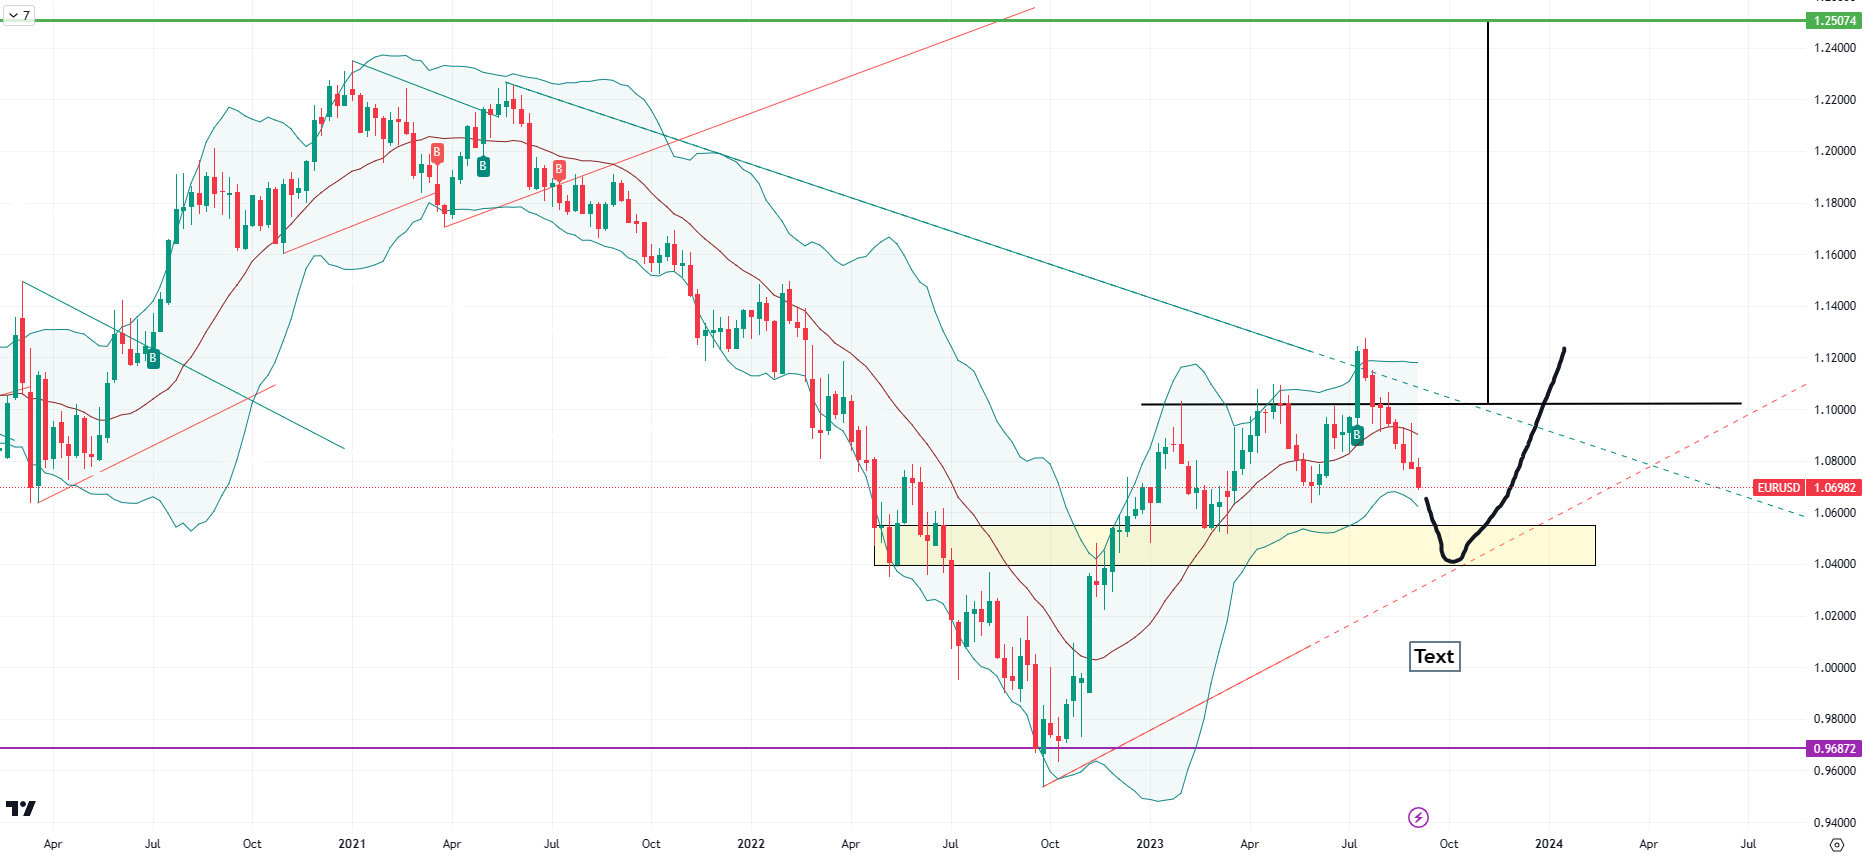
While it is entirely possible for EUR/USD to fall back into the yellow rectangle I’ve drawn above there is a supporting trendline that indicates to me at least a potential reversal around the 9th October 2023 onwards.
A weaker USD suggests that risk asset values and precious metals will rise in Q4 2023 as a risk on environment is launched. In addition and as mentioned in previous articles, a weaker USD provides positive tail winds for US Multiple Nationals trading abroad in non-USD currencies. A weaker USD allows them to post higher USD returns in their Earnings. With this in mind the Stock Market usually prices in 6 months forward looking numbers. In this case we could see equities rise in Q4 2023, as earnings which will be reported in Q1 and Q2 2024 will be stronger due to currency fluctuations
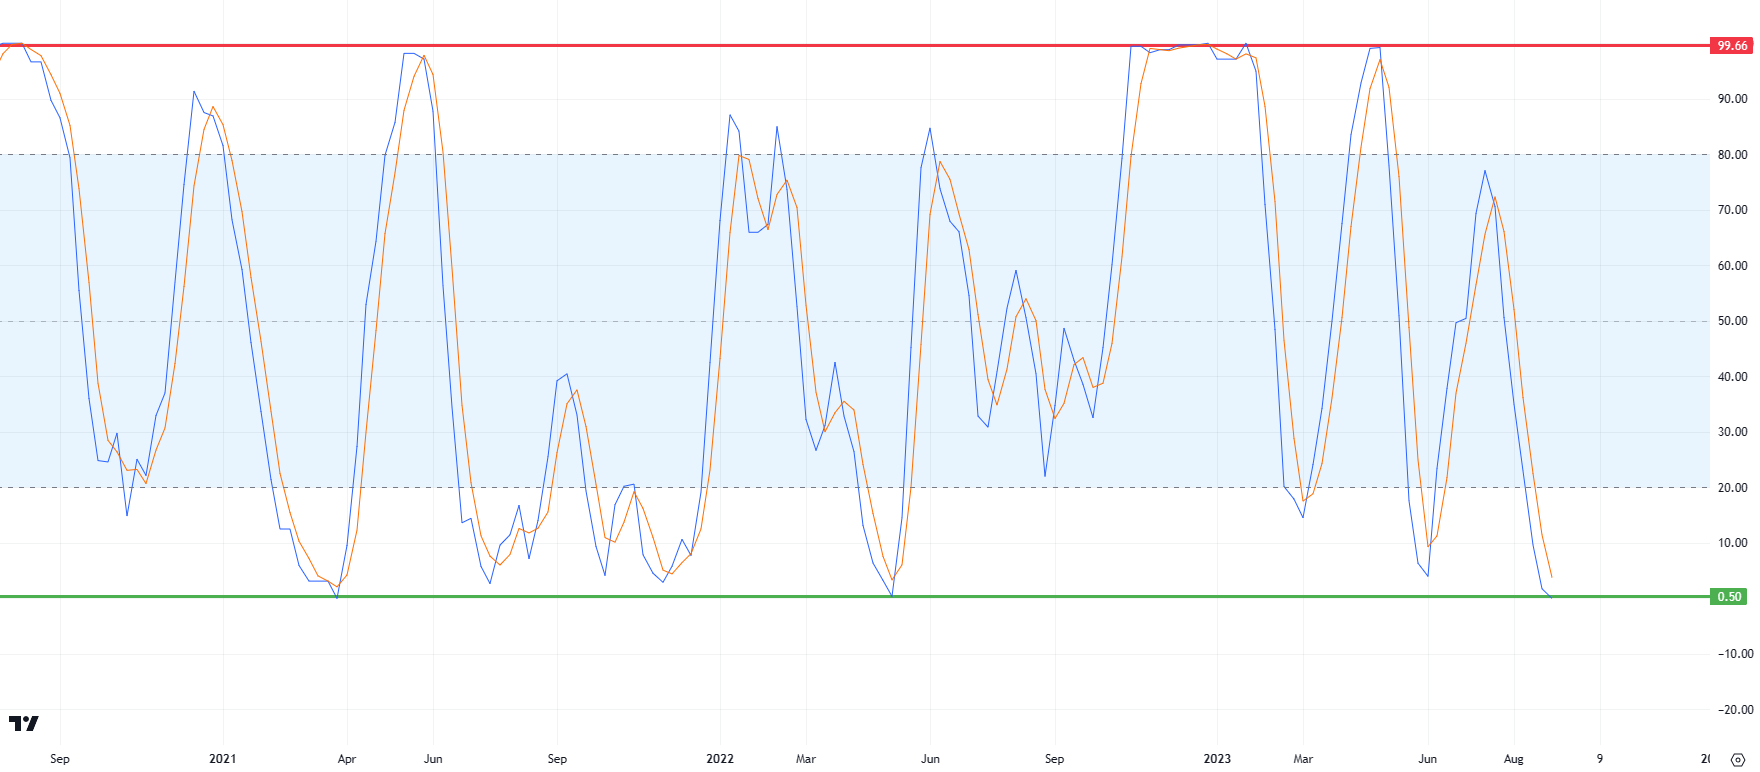
And similar to the DXY being over bought, EUR/USD appears to be over sold on the above chart. The trend is about to break in my view.
GOLD
Zooming out over a decade (sorry its not a log chart) on Gold/USD and there is the well highlighted Cup and Handle Pattern, of which we have been holding the handle for over 2 years. If USD does begin to weaken in the coming weeks, we should expect Gold to break above the $2,000 level and if it can stay there might commence a new bull market cycle for the precious metal with a measured move price target of over $2,700 on a very long timeline.

De-Globalization and Recessionary Impulses
Another point worth making is that if there is a global recession and if there is continued momentum on de-globalized trade, there will be less need to transact in USD and as a result demand for USD will reduce. While I’m not convinced about the BRICS and the De-Dollarization strategy I do believe that when trade demand falls, demand for USD falls too and this might have an impact.
Yentervention Coming?
Will the Fed and other Central Bankers come to the aid of the weakening Japanese Yen. From a trading perspective, Japan will be stealing a march in the Asian markets given the weakens of its currency comparatively to the US Dollar.

The peak USD/JPY got to was in October 2022 (the low of the US Equity Market) and there was some form of heavy FX Intervention at play. Japan is the largest external holder of US Treasuries in the world. The US can’t afford for Japan to dump all these US Treasuries on the market, pushing yields and fiscal debt affordability higher, to protect the Yen currency. So before things get that severe, it makes more sense that USD/JPY will fall back before the 140 level and give respite to that situation, but it would back up the weakening USD concept.
Conclusion
The DXY (and the USD) could be about break down in the coming weeks and we are potentially moving into a Risk On environment. If DXY breaks above 107.50 this may disprove my thesis and similarly if EUR/USD breaks below 1.05 then again it may not be the risk on environment I am looking for. So the next couple of weeks to early October will be very telling for how FY2023 finishes.
I remain cautiously bullish, using no leverage.
NB: This is not financial advice, please speak with your own financial advisor before deploying any of your hard earned capital.
Remember if you liked this article and want to support the channel you can always buy me a coffee via the link below.
https://www.buymeacoffee.com/walkinggentleman, its totally discretionary and as little as €5.00. Yep coffee is expensive these days.