

Trick 'RRP Treat
Trick 'RRP Treat
Give Treasuries something nice to eat.....

As the Fed FOMC is scheduled for the day after Halloween its no wonder the market has been spooked over the last few weeks.
The rapid fire reduction of the Reverse Re-Purchase Facility (“RRP”) from $2.2tn to $1.1tn in just 5 months should suggest that US Treasuries would catch a bid. However it is unclear whether the RRP reduction offers a Trick or a Treat. For this and other macro musing please read below.
US YIELD CURVE
Lets take a look at a snapshot of 6 months ago (April) and today.
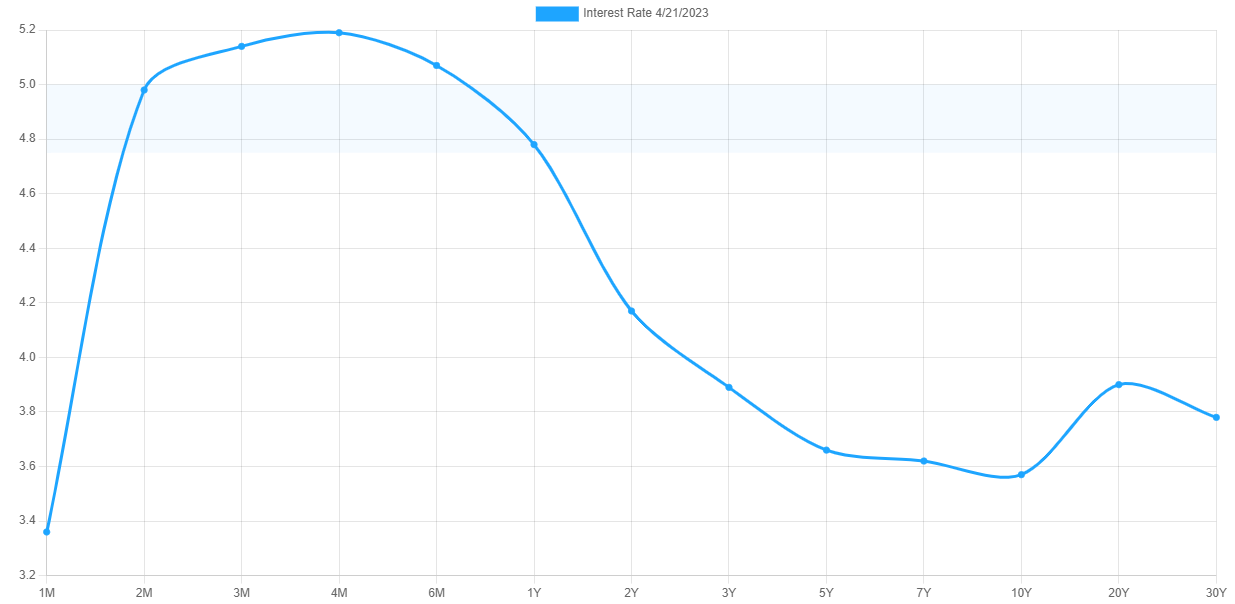

Obviously all the yields have risen but interestingly the short term shelter of the 1M has ceased and risen in line with the 2M - 6M levels. The belly of the curve hasn’t moved dramatically albeit 5s/10s have inverted. Further out on the curve the 2s/20s have inverted with the US20YR steepening much more aggressively comparatively to the 10s and 30s. (See all my writings on Short TLT in the archive from March).
So its been the start of a bear steepener, but in all seriousness, not a lot of movement really bar the 1M and the US20YR.
In short, if the long end steepener faster than the short end and inverts, its a soft/no landing, but if the short end drops faster than the long end than its a bull steepener and likely caused by a Fed Rate Cut due to worrying economic data or hard landing / recession.
The jury is still out and given the lead into Christmas its more probably that any significant movement occurs in the New Year / end of Q1 2024.
REVERSE REPO (“RRP”) POT
There have been a significant amount of New Treasuries issued by the US Government into the market place since the Debt Ceiling was lifted. That paper has been bid up and the RRP has been drained 50%, yet yields remain high on the long end. This means there is more paper in the market than there is cash.
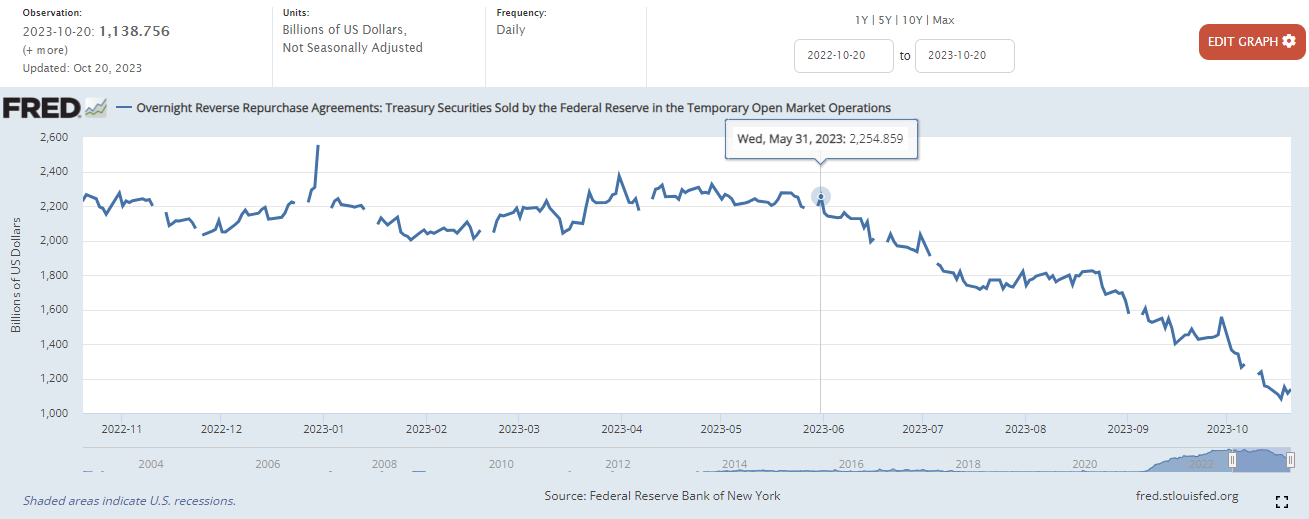
Has this use of the RRP or what I like to call deferred QE made any difference? For me, yes it has, it has provided liquidity in a time post June when liquidity started to drain away from the March/April Banking Crisis days. There is talk now of allowing pension and insurance funds to acquire US Treasuries and GILTS using leverage.
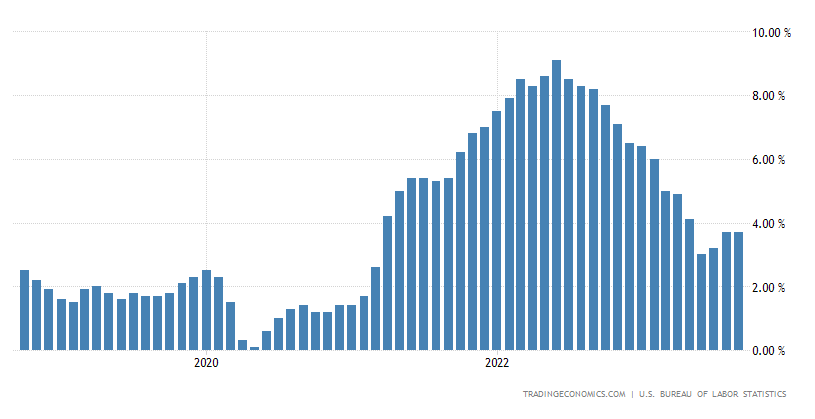
US CPI PRINT
It seems the days of tracking CPI and getting excited on a print are over (at least for me), does this mean that inflation has found its bottom around the 3.7% level? Given we have seen levels at 9.1%, does it really matter whether inflation is running at 3.7% compared with the Fed’s target of 2.0%? The market seems to be able to cope with it for now at least. I don’t know the answer, stuff keeps getting more expensive but what does that mean for the economy and GDP.
US FISCAL DEFICIT
US Debt exceeded $33 trillion when the debt ceiling was lifted in the summer. It has extended well over $500 billion since breaking the $33 trillion level. So it gives some food for thought when you get the below quote in June 2023 and explains as above the drain on the RRP.
“Deficit reductions under the Fiscal Responsibility Act of 2023 reduce projected federal debt in 2033 by about 3 percent, from $46.7 trillion (or 119 percent of gross domestic product, or GDP) to $45.2 trillion (or 115 percent of GDP).”
- Congressional Budgetary Office (“CBO”)
If you aren’t looking at a Store of Value for your cash savings, I’m not sure what to tell you. This is the most obvious case for currency debasement you may ever see. The US Government are literally planning on doubling their Debt from what was $20 Trillion in 2019 to over double that within 14 years. Gold and to some degree Silver and even Bitcoin for that higher beta / possible alpha return within 2 years.
US NOMINAL GDP
This seems to be one of the economic metrics to watch now. Nominal GDP was $27 trillion in Q2 2023 at roughly 6.1% growth. Real GDP is at 2.4% adjusted for inflation, i.e. the delta being a magical 3.7% (see CPI print above).

At 6.1% this suggests that there is room for the long duration bond yields to run higher from the 5.0 - 5.2% levels today with the US30YR and US20YR respectively. Higher for longer? Maybe? The Fed might well be done at the front end / Fed Funds Rate of 5.25 - 5.50% but it doesn’t control the long end. My sense is that we will see the long end push towards this 6.1% unless there is a dramatic change in Nominal GDP for Q3.
So the actionable option is to return to a Short TLT which I fully exited at $84.50, having been scaling out of the position from $92. I don’t think any new position will be big, but seeing what I am seeing, I feel I need to back it up with a small position at least. I might try to catch a retracement if I can and look to enter around $87/$88 if possible. If not, then I have missed it.
With Nominal GDP high and inflation still relatively high, it suggests a High Beta / Short Bonds positioning, targeting Growth over Value. Value Stocks derived “value” from discounted cashflows which will continue to be discounted at the current rate of inflation. Meanwhile Growth Stocks don’t suffer as much on a discounted basis in the event of high growth potential.
CONCLUSION
The draining of the RRP is both Trick and Treat. Treat in the way it has provided liquidity as the deferred QE I spoke about before, helping to drive the SPX back up from $3600 levels to $4500 (now sub $4200 as I write). Trick in the way it is actually fueling a very obvious (yet silent in mainstream media) currency debasement. As US fiscal deficit continues run wild, with prices high and sticky due to the toppy inflation experienced in 2021/2022, it is not far fetched to think that US Nominal GDP will continue to push higher in $ terms and in % terms. The Q3 print will tell a lot.
The front end / Fed Funds Rate might not go higher, but it does really seem that rates could stay higher for longer. If Nominal GDP continues to push higher, we may see 1 or even 2 more rate hikes as economic growth remains robust.
NEXT TIME
Next time I will turn my attention to the USD and Japan. I’m not as convinced my Whistling DXY paper will bear out, it has so far, but its about to be tested again. Really watching whether USD will dictate if we see a Santa Rally this year.
The Japanese conundrum is getting very curious. USD/JPY breached $150, JGB yields pushing out, are we about to see something different, is the BoJ about to raise interest rates? Something has to happen as it appears at tipping point. The last Japanese FX intervention with USD/JPY above $150 was in October 2022 (the market lows).

Until then we have Fed Chair Jay Powell’s FOMC presser on Weds 1st November. I wonder if he dresses like a hawk or a dove?
NB: This is not investment or financial advice, speak to your own professional team before investing any of your hard earned cash in these crazy markets.
You can support my writing by subscribing to my two other Substacks
DILLIE (focused on start ups and entrepreneurs)
The Daily Grin (motivational thought of the day with My Top 5 stories of the Day).
OR
You can buy my a cup of coffee clicking the link here https://www.buymeacoffee.com/walkinggentleman
Wow! What a nice resume of the actual situation!!! Merci!👌
Excellent post. Very well written!