

US Housing Market Decline #1
US Housing Market Decline #1
Interest Rates destroy affordability

How could the US Housing Market collapse? As Ernest Hemingway wrote in his novel The Sun Also Rises, when the character named Mike is asked how he went bankrupt. “Two ways,” he answers. “Gradually, then suddenly.”
Kids love bubbles. I could blow bubbles for 20 minutes and my kids would not stop running around like headless chickens. We are looking at the bursting of a 40-year bond bubble, a steady sell off of equities, yet Median House Prices have continued to creep up and up.
In mid-September this year, Zillow updated their Housing Market forecast.
“Zillow economists updated that forecast. They now predict that 259 of the nation’s 896 regional housing markets are likely to see declining home values between August 2022 and August 2023. Of those, four markets are predicted to see home value declines of greater than –5%.” - Yahoo Finance
I’ve got to tell you this seems extremely low to me. I should also mention that Zillow’s base case is that broadly speaking the US Housing Market grows 1.4% between August 2022 to August 2023.
For me housing has a 6-9 month lag on real value/ price action, i.e., it takes over half a year to unwind what the purchasers are paying for the housing because (in the most recent cycle) of the inventory available as opposed to the demand. This is particularly noteworthy when you consider a dip in supply experienced due to labor shortages and high costs of building materials between December 2021 to March 2022.
US30YR Average Fixed Rates
This housing cycle is going to be about affordability. Can the purchasers actually afford to buy at these prices? One year ago, the Average 30 Year Fixed Rate US Mortgage was 2.88%. That rate now sits at a staggering 6.29%. This is the highest mortgage rate level since October 2008. With Median US Home Prices at $440,300 and say a Loan-to-Value (“LTV”) of 80%, a rounded mortgage would be $350,000. In Sept 2021 that repayment would have been $1,453 per month, one year later and a $350,000 draw down would cost $2,164 per month, an additional $711.
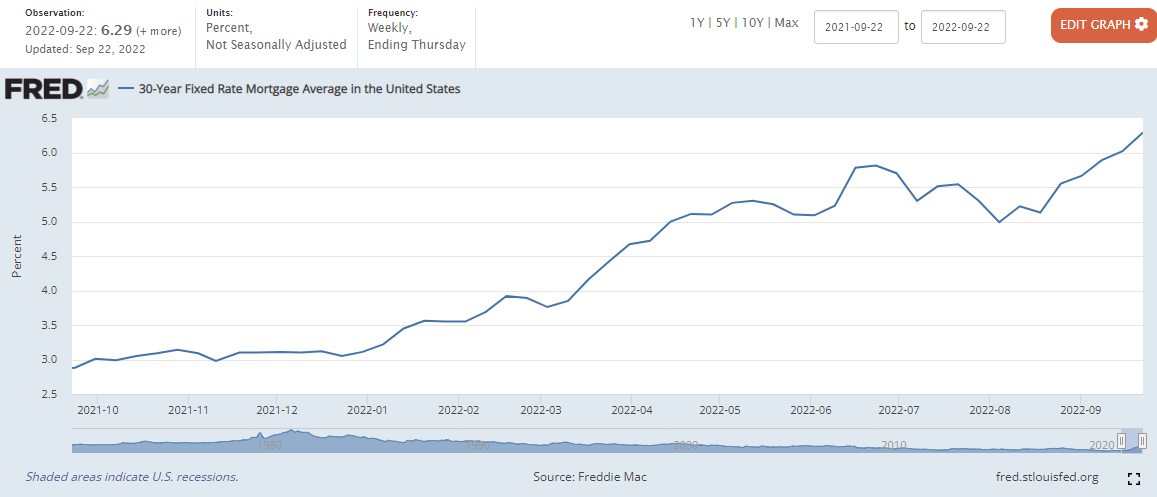
30 YEAR AVERAGE US FIXED MORTGAGE STANDS AT 6.29% (22nd Sept 2022)
Another factor to consider is that with Homeowners with mortgages locked into a 30 Year Fixed rate below the current mortgage rate, they will be unwilling to sell their current homes and buy again locking in a higher mortgage rate. While this could ease pressure on new home inventories as the secondhand supply is lower, it negatively affects the attractiveness of Mortgage Back Securities (“MBS”).
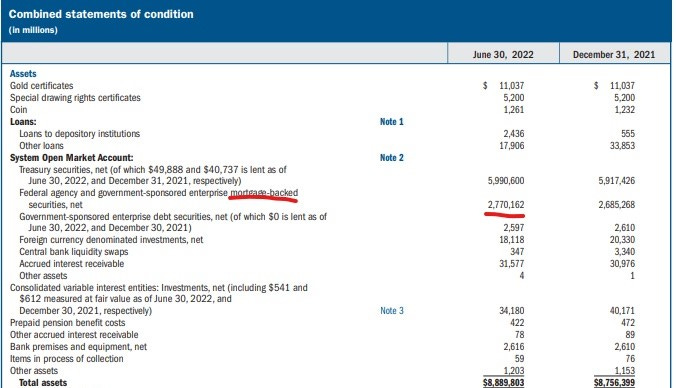
Federal Reserve Balance Sheet of $8.889TN (30.06.22) is made up of 31.16% MBS Products
The Fed hold over $2.77TN of MBS on its Balance Sheet at Q2 2022, all at low yielding mortgage rates. The plan is to sell down this collateral in due course as part of the Fed’s QT plan. However, with homeowners unlikely to sell their homes due to their positive mortgage rate, it will limit the amount of MBS buyers, because while the MBS products have long duration expiry, you would usually expect earlier redemptions for your cash flow, but this will likely not be the case should homeowners not sell their secondhand homes. The old rate they have locked in becomes very valuable in a high interest rate environment.
Going back to the increased repayment capacity issue. The median household income in the US is c. $70,500 or about $5,000 net per month depending on which State you reside. The $1,453 mortgage repayment v $5,000 is 29% of net monthly salary while the higher $2,164 v $5,000 is 43%. Lending criteria will not soften, if anything it will tighten, leading to three possibilities.
more consumer demand destruction as disposable incomes erode (less discretionary spend) or
the price of housing falls and lastly
mortgage interest rates fall.
No. 3 seems off the cards for the moment, but interest rate cuts could fall, perhaps not in 2023, but most likely as we approach 2024 as economic data likely weakens further. In order to return to the $1,453 monthly repayment, the mortgage drawn amount would have to fall from $350,000 to $235,000, by $115,000 or 32.85% of the mortgage. Leaving aside where the equity cheque comes from, higher rates would more likely reduce the Median US House Price from $440,300 to $325,300 over the next 3 to 5 quarters. These lower median price levels would take us back to Q2 2017 prices.
Mortgage Applications WoW
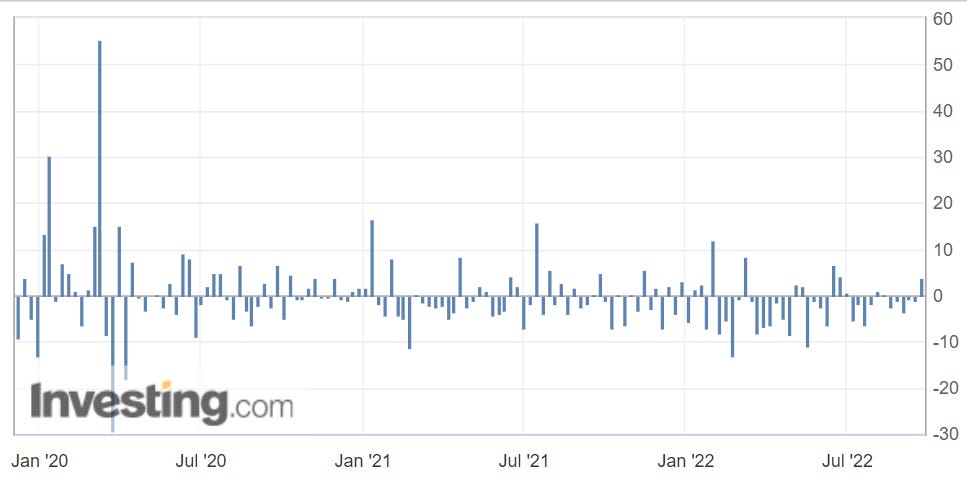
Week over week % Mortgage Application by Investing.com
The above chart shows the reducing numbers of US Mortgage Applications over the last 18 months. Saying that, there was a 3.8% uptick last week, being the highest increase week over week since June 2022. As these numbers are provided on a cumulative basis there has been a steady reduction in Mortgage Applicants while interest rates have increased. However, the US Median House Price sold has been steadily growing, for me, a classic sign of a bubble formation.
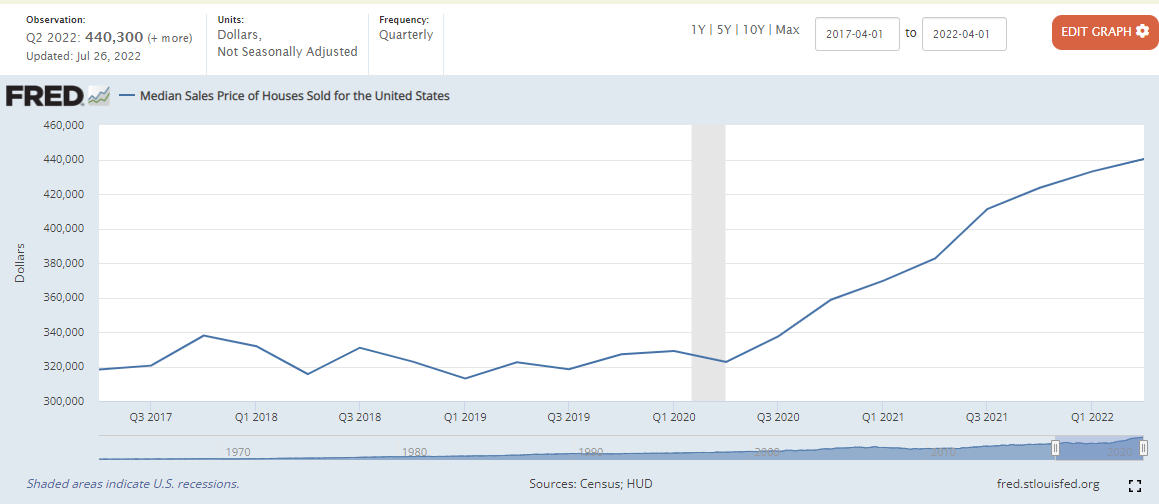
Median Sales Price of Houses Sold in the USA at $440,300 (July 26th, 2022)
You’ll have to recall in 2021 when the 2022 New Homes Inventories were built there were serious cost burdens, 1) lumber and copper prices were at record highs, 2 construction labor shortages and resultant wage inflation, 3) the equity market was at its peak, whereby Homebuyers were able to unlock profits and use them for higher Equity Cheques. Now that there are no profits from the Equity Market to be taken out, savings have reduced and interest rates have risen aggressively, we should see Median Sales Prices drop from the Q2 2022 prices listed above at $440,300, closer to $400,000. It shouldn’t be a dramatic reduction, but I am looking for a trend indication to the downside at least for the next 6-9 months.
For those in their late 30’s and beyond we remember only too well the Property Crash of 2008 of the Global Financial Crisis. This cycle has been very different. Lending has been reasonable, no teaser or discounted initial rates, no flood of covered bond products or synthetic Collateral Debt Obligations (“CDO’s”) and certainly no aggressive “subprime” mortgages. This time though affordability issues appear to have skyrocketed without the same rate of debt.
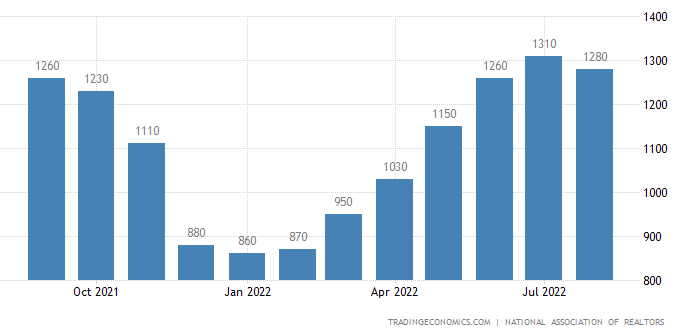
US Housing Inventory in the last 12 months, noting the lows between Dec 2021 to March 2022
Over the same period (in the chart above) the Median US House Price Sold increased from $384,600 to present $440,300. For me this is testament to the mid 12-month lows between Dec 2021 to March 2022. As inventories reduced, the buyer levels stayed roughly the same, but started to fall from July 2021 (Mortgage Applications data) and the price of houses sold increased 14.48% on a median basis. The Mortgage Applicants in the July 2021 peak may have been caught holding the bag, likely closing their properties 6-9 months later.
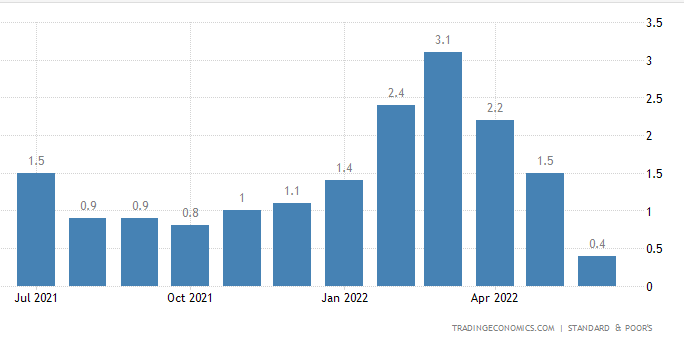
Case Shiller Index US House Price Index MoM July 2021 to June 2022
After looking at the Median basis, when we focus on the Case Shiller Index, we can see the rate of price growth peaked in March 2022 at 3.1%, just when inventories climbed back above 1,030,000 in April 2022. The 0.4% print from June 2022 is the last number I have from a data perspective, but it is suggestive of the beginning of a downward trend, however it is confirmation that the price growth peak of March 2022 has been sticky for at least a trailing 3-month period.
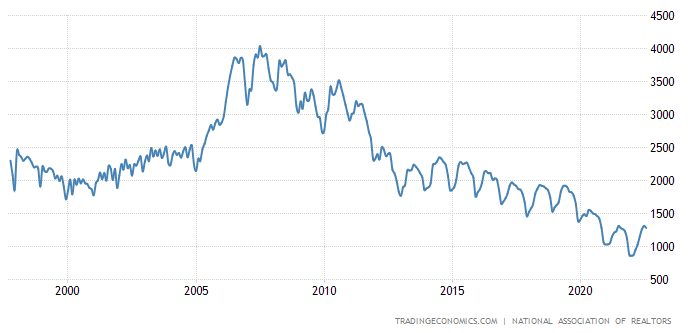
25 Year US Housing Inventory Cycle peaking in 2008
When we zoom out, we will see that over the last 25 years we have seen a downward trend in Housing Inventories from peak 2008, but from March 2022 we have seen that uptick in inventory levels. These low levels of inventory also marked the peak in Copper and Lumber prices as mentioned previously. Now that these commodities prices have subsided Home Buyers can probably make a higher development margin, as long as they get the same End Price from the Buyers (but for how long, as price growth appears to have peaked). US Housing Starts were 1.575m in September, up from 1.45m forecasted and the prior month 1.446m.
Conclusion
In short, Inventories look likely to continue to grow just as Homebuyers decline. I am looking at this autumn cycle as a key indicator of direction being 6 months presently from the growth peak in March 2022. The proof will be in the pudding if the Inventory numbers continue that upward tick. Simply put as the number of houses on the market increases and the number of buyers decrease due to affordability issues, in my view, we have genuine price discovery ahead.
SUPPLEMENTAL TO ORIGINAL RELEASE 12.39pm GMT 27th Sept 2022
Updated Case Shiller Index July
The data now shows that prices have indeed fallen while Sales Volume increased as Buyers rushed to buy while rates were lower.
NB: This article does not constitute financial advice and you should contact your own independent financial advisor before making any investment decisions in these volatile times.
Nice summary on the US market! It would be interesting to see the corporate demand over there as well as that was going gangbusters - at least last year anyway!